Mobile Ad ROI for Teacherpreneurs: Guide
Want your education app or course to succeed? Start tracking ROI.
Mobile ads can drive big results for teacherpreneurs, but spending money on ads doesn’t guarantee profit. To ensure your campaigns are working, you need to measure ROI (Return on Investment). This means understanding how much revenue your ads generate compared to the total costs of running them.
Key takeaways:
- ROI Formula: (Total Revenue – Total Cost) ÷ Total Cost × 100
- Key Metrics: Cost Per Acquisition (CPA), Lifetime Value (LTV), and Return on Ad Spend (ROAS).
- Benchmarks: Aim for CPA under $1.00 and a ROAS of at least 2.04 for profitability.
- Boost ROI: Focus on audience targeting, ad creativity, and A/B testing.
Platforms like Google Ads, TikTok, and Apple Search Ads can connect you to the right users. Use tools like Google Analytics and Appfigures to track performance and optimize campaigns. Success stories from apps like SplashLearn and Reading Eggs show how data-driven strategies lead to higher downloads and revenue.
Stop guessing - start tracking ROI and make every ad dollar count.
ROI Basics and Key Metrics
Mobile Ad ROI Key Metrics and Benchmarks for Educational Apps
What is ROI and Why Track It?
Return on Investment (ROI) is a key performance indicator that measures how profitable your mobile ad campaigns are. It does this by comparing the revenue generated to the total costs involved - like ad spend, app development, maintenance, and other marketing expenses. For teacherpreneurs, ROI answers a critical question: Is the money you’re putting into promoting lesson plans or educational apps actually paying off?
Tracking ROI ensures that a spike in downloads translates into real profit. Sure, high download numbers might look great on paper, but if the cost of acquiring those users outweighs the revenue they bring in, the campaign is a bust. Abdul Moiz from ActiveCalculator puts it well: “Measuring ROI is vital for justifying marketing spend, optimizing campaign performance, and identifying areas for improvement”. In fact, teacherpreneurs who consistently monitor ROI are 1.6 times more likely to secure bigger budgets for their campaigns.
It’s also important to understand how ROI differs from ROAS (Return on Ad Spend). ROAS zeroes in on revenue generated specifically from ad spend, while ROI takes a broader view, factoring in all costs associated with app promotion. While ROAS helps you assess how efficiently your ad dollars are working, ROI gives you the full financial picture, making it a more comprehensive tool for evaluating profitability.
Key Metrics for Mobile Ad Campaigns
Beyond ROI, there are several other metrics that can help you figure out where your money is going and what’s driving your results:
- Cost Per Acquisition (CPA) / Cost Per Install (CPI): These metrics tell you how much it costs to acquire a new user. For educational apps, successful campaigns often bring this cost down to less than $1.00, compared to the industry average of $2.50. If the cost to acquire a user is higher than the revenue they generate, the campaign isn’t sustainable.
- Lifetime Value (LTV): This measures the total revenue a user contributes over their entire relationship with your app. For subscription-based teaching tools, your LTV must exceed your CPA to make a profit.
- Conversion Rate: This shows the percentage of people who see your ad and take the desired action. For example, Apple Search Ads boast a conversion rate of 67.2%, while social media platforms average around 2.0%.
- ROAS (Return on Ad Spend): This metric evaluates how effectively you’re spending on ads. The median ROAS for mobile apps is 2.04, meaning apps typically earn $2.04 for every $1 spent on advertising. Educational apps with strong targeting can even hit a 200% ROI within 18 months. To avoid losses, you can calculate your break-even ROAS using the formula: 1 ÷ Profit Margin. For example, with a 50% profit margin, you’d need a ROAS of at least 2.0.
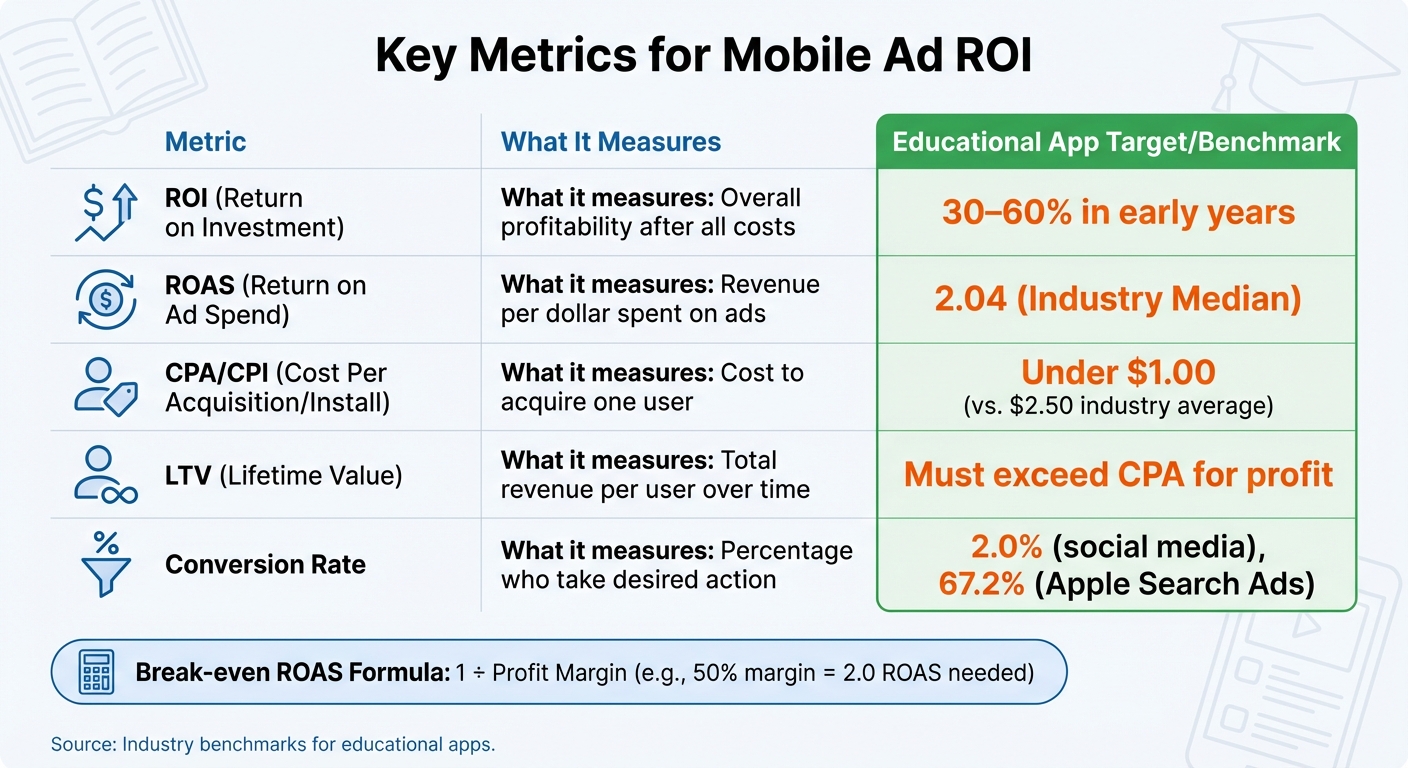
Here’s a quick snapshot of these metrics and their benchmarks:
| Metric | What It Measures | Educational App Target |
|---|---|---|
| ROI | Overall profitability after all costs | 30–60% in early years |
| ROAS | Revenue per dollar spent on ads | 2.04 (Industry Median) |
| CPA/CPI | Cost to acquire one user | Under $1.00 (vs. $2.50 average) |
| LTV | Total revenue per user over time | Must exceed CPA for profit |
| Conversion Rate | Percentage who take desired action | 2.0% (social), 67.2% (Apple Search) |
Next, we’ll dive into the calculations that bring these metrics into focus.
How to Calculate Mobile Ad ROI
The ROI Formula Explained
The formula for calculating ROI is simple:
[(Total Revenue – Total Cost) / Total Cost] x 100
This equation gives you a percentage that indicates whether your mobile ad campaign is profitable or not.
Here’s an example: Imagine you spend $5,000 on ads and generate $12,000 in revenue. Your net profit would be $7,000, resulting in a 140% ROI. In this case, every dollar spent returns $1.40 in profit.
However, it’s important to track all associated costs accurately. Beyond ad spend, consider other expenses like creative fees, app store commissions (which can range from 15% to 30%), hosting fees, and other campaign-related costs. For instance, if you add $2,000 in creative costs to the original $5,000 spend, your total investment climbs to $7,000, dropping the ROI to 71%.
For subscription-based apps, revenue from new users may not be immediate - it might take weeks or months to materialize. To address this, many marketers use predictive ROI (pROI). This approach relies on early user behavior, typically observed within the first 24–48 hours, to guide quick decisions about scaling campaigns. With this method, you can refine your ROI calculations and adapt faster to market needs.
Identifying Costs and Revenue Sources
To get an accurate ROI, you need to map out every cost and revenue source. Let’s break it down:
Costs to Consider
Teacherpreneurs and app developers face both fixed and variable costs. Fixed costs might include app development, which can range anywhere from $20,000 to $500,000 depending on the app’s complexity. Variable costs, on the other hand, fluctuate and include things like monthly ad spend.
Key cost categories include:
- Ad spend across platforms like Meta, Google, or Apple Search Ads
- Creative production for videos, graphics, or copywriting
- Platform fees from App Store or Google Play (typically 15–30% of sales)
- Operational expenses such as server hosting, customer support, and app maintenance
Revenue Sources
On the revenue side, teacherpreneurs typically generate income through:
- Subscriptions: Recurring monthly or annual fees
- In-app purchases: One-time payments for premium features or lesson plans
- In-app advertising: Revenue from ads shown to free users
- Sponsorships: Collaborations with educational brands
For many educational apps, the average revenue per user (ARPU) falls between $10 and $30 per month.
Calculating Break-Even ROAS
Another essential metric is your break-even ROAS (Return on Ad Spend). You can calculate it using this formula:
1 / Profit Margin
For example, if your app’s profit margin is 75% - a common figure for digital subscriptions - you’ll need at least a 1.33x ROAS to cover your costs. MoldStud explains it well:
"ROI = (Net Profit / Cost of Investment) * 100. This will give you a percentage that indicates how profitable your app is relative to the amount of money you invested in its development and marketing".
How to Improve Mobile Ad ROI
Once you’ve got a clear understanding of your numbers, the next step is figuring out how to make your campaigns more profitable. Even small changes can lead to noticeable results. Some businesses have managed to reduce marketing costs by up to 20% while improving outcomes.
To boost your mobile ad ROI, focus on three key areas: targeting, creative content, and testing. Each of these plays a direct role in driving better performance.
Optimizing Audience Targeting
Getting your audience targeting right is essential. Instead of reaching everyone, break your audience into specific segments based on demographics (like age or location), psychographics (such as interests or values), or even learning styles (visual, auditory, kinesthetic).
For teacherpreneurs, behavioral targeting can be especially effective. Use insights from app usage - like which features users spend the most time on or their feedback - to create ads tailored to their habits. For instance, if a user often uses your math worksheets but hasn’t upgraded, show them ads focused on premium math content.
Retargeting is another powerful tool. Users who have interacted with your brand before but didn’t convert are 70% more likely to make a purchase than brand-new users. Target these warm leads to increase conversions.
Platforms like Facebook also let you build lookalike audiences - groups of people who share traits with your best customers. This approach helps you reach new users while maintaining relevance. For example, 83% of teachers already use digital tools in their classrooms, making them a high-potential audience. You can also focus on specific groups, like parents of kids aged 5-12 (over 70% of whom want extra educational tools) or professional educators on LinkedIn.
Some companies have seen major success with precise targeting strategies. In December 2021, Lingokids ran an aggressive campaign in the App Store, using 3,716 ad creatives and 3,336 paid keywords in the U.S. to secure their brand name and capture search intent. Similarly, Headway localized 25% of their impressions for Spanish-speaking users in the U.S. and Mexico, showing how platform-specific adjustments can drive results.
Once you’ve nailed your targeting, the next step is crafting ads that grab attention.
Creating High-Performing Ad Creatives
Your ad has just 10 seconds to make an impression - more than half of viewers drop off quickly. To keep them engaged, use eye-catching visuals with bright, contrasting colors, which can boost engagement by 80%. Including human faces can further increase interaction by 38%.
Start your ad with a strong hook in the first few seconds. Use a mix of images and text to spark curiosity, like “Here’s a secret teaching hack...”. For video ads, remember that up to 85% of social media users watch without sound, so closed captions are a must to keep viewers watching.
Content created by actual users - user-generated content (UGC) - resonates more than traditional ads. In fact, 79% of consumers say UGC influences their buying decisions. Combine this with social proof, like testimonials or success stories, since 92% of people trust recommendations from others over branded content.
Keep your ad copy short and to the point. Address a specific problem your audience faces and use action-oriented language. A strong call to action (CTA) can make a huge difference - specific phrases like “Start Learning Now” or “Join Our Community” can increase click-through rates by up to 200%.
"80% of consumers prefer personalized content. Tailor your copy to speak directly to their interests, aspirations, and pain points." - MoldStud Research Team
Once you’ve polished your ad creatives, it’s time to test and refine them.
A/B Testing for Better Results
Guessing what your audience will respond to is tricky, which is why A/B testing is so valuable. Testing different versions of your ads can boost conversion rates by 49%.
The key is to change only one element at a time. For example, test just the headline, image, or CTA - never all at once. This way, you’ll know exactly what caused the change in performance.
"A/B testing relies on changing just one variable to conduct the experiment." - Outschool Educator Library
Run your tests for at least 4 to 14 days to get enough data and account for daily variations. Meta recommends running tests for a minimum of 4 days to ensure accurate results from its reporting tools. Make sure your budget is evenly distributed across all variations so each one gets fair exposure.
Focus your tests on critical elements like headlines, main visuals, and value propositions. For instance, compare benefit-focused headlines with urgency-driven ones, or test product-centric visuals against lifestyle imagery. And don’t just look at surface-level metrics like click-through rates - track deeper actions like app installs, sign-ups, or purchases to measure true success.
sbb-itb-4f1eab7
Tools and Platforms for Measuring Ad Performance
Tracking your mobile ad performance doesn’t have to be complicated. With the right tools, you can uncover spending details and measure how effective your ads are. Many teacherpreneurs rely on a mix of free and paid platforms to get a full picture of their campaigns.
Analytics Tools for Tracking ROI
Google Analytics for Firebase is a great place to start - it’s free and offers unlimited usage. One of its standout features is the ability to track ad revenue at the impression level, letting you see exactly how much each ad generates. This is crucial for calculating metrics like Lifetime Value (LTV) and Average Revenue Per User (ARPU). By linking your AdMob account to Firebase and Google Analytics, you can consolidate all your data in one place. During setup, the DebugView feature helps ensure your ad_impression events are logged accurately, complete with correct currency and value parameters.
Google AdMob Dashboard is another useful tool, offering daily insights into your app’s performance. It provides data on estimated earnings, eCPM (Effective Cost Per Thousand Impressions), and match rates. The dashboard also includes specialized cards that highlight your top-performing ad networks and individual ad units. Keep in mind that revenue data is updated within 72 hours to reflect finalized earnings and exclude any invalid activity.
If you’re managing multiple platforms, Appfigures is a powerful tool that centralizes data from iOS, Google Play, Amazon, and ad networks like AppLovin, Facebook Audience, and Unity Ads. It tracks key spend metrics such as CPA (Cost Per Acquisition), CPC (Cost Per Click), and CTR (Click-Through Rate) alongside revenue. They even offer a free trial - no credit card required. Similarly, Apps Finboard syncs data across platforms three times a day, giving you a clear view of your profit margins.
| Tool | What It Does | Key Metrics |
|---|---|---|
| Google Analytics (GA4) | Tracks user behavior & LTV | ARPU, LTV, Ad Revenue, Retention |
| Google AdMob | Manages monetization & mediation | eCPM, Match Rate, Estimated Earnings |
| Appfigures | Centralizes app metrics | CPA, CPC, CTR, Ad Spend, Downloads |
| Apps Finboard | Shows profit/loss dashboard | Revenue vs. Cost, Daily Profit, Multi-app ROI |
When setting up these tools, double-check that your time zones are consistent across platforms to avoid reporting discrepancies. If you’re using a third-party mediation platform, consider logging events manually with impression-level revenue data instead of linking AdMob to Firebase. This prevents the risk of double-counting your revenue.
By combining these tools, you can gain a complete view of your ad performance and turn data into actionable insights.
DashK12 Resources for Teacherpreneurs
While analytics tools provide detailed data, DashK12 helps you turn that data into strategies tailored for teacherpreneurs. We offer online courses, e-books, and resources designed to help educators transition into entrepreneurship. Whether you’re promoting an educational app, selling digital products, or building a membership community, DashK12 simplifies complex topics like mobile ad ROI into practical steps you can apply immediately. For busy educators, it’s a one-stop shop for actionable advice and entrepreneurial success.
Case Studies of Successful Teacherpreneur Campaigns
Here are some standout examples showcasing how teacherpreneurs have successfully used creative strategies and precise targeting to boost their mobile ad performance.
Success Story: Increasing App Downloads
SplashLearn made a big splash by refining their Apple Search Ads strategy. Starting in May 2020, Mithun Jhawar, the Senior Digital Marketing Manager, leveraged their Mobile Measurement Partner data through SearchAds.com. They categorized campaigns into four groups - Brand, Competitor, Discovery, and Generic - to pinpoint download sources more effectively. By automating bid management and conducting in-depth keyword research, they saw a 160% jump in downloads in new markets and a 40% rise in Tap-Through Rate (TTR). Plus, they cut optimization time from several days to just one day.
"With SearchAds.com's automation features and intuitive dashboard, we were able to get a 160% uplift in downloads in new markets."
– Mithun Jhawar, Senior Digital Marketing Manager, SplashLearn
Success Story: Boosting Downloads with Custom Product Pages
Reading Eggs, developed by Blake eLearning, took a tailored approach by creating custom product pages that aligned with specific search terms. Marketing Manager Emilee O'Reilly designed separate landing pages for their phonics and math programs, ensuring users encountered content directly tied to their search. This strategy was responsible for 42% of their yearly iOS downloads across the U.S., U.K., and Australia, with a 52% increase in trial sign-ups in the U.S. Additionally, custom pages increased conversion rates by 7% compared to generic pages.
"With custom product pages, we can direct customers who are searching for something specific to a highly relevant message with visuals that reference that search term."
– Emilee O'Reilly, Marketing Manager, Acquisition, Blake eLearning
Success Story: Localized Keyword Strategies
Edoki's Montessori Preschool app leaned into localized keyword strategies to expand its reach. Chloe Jobert, their Acquisition Manager, utilized Apple Search Ads' Search Match tool to uncover region-specific keywords and ramped up bids on seasonal terms like "homeschooling" during the back-to-school season. This approach led to 100% global subscriber growth year-over-year and a 60% boost in annual subscriptions. Notably, 80% of downloads in new markets came directly from Apple Search Ads, with a 10% conversion rate.
"Apple Ads drives the best acquisition results. It helps us understand new markets quickly, grow our base of customers, and drive more valuable subscriptions."
– Chloe Jobert, Acquisition Manager, Edoki
Success Story: Converting Free Users to Subscribers
Eltsoft LLC revolutionized its revenue stream for the "English Grammar" app by swapping out banner ads for rich-media interstitials. These ads, featuring text, images, and video, appeared at natural breaks between quizzes. The results were astounding: revenue skyrocketed by 2,000% overnight after implementing interstitial ads via Google AdMob. By using Google Analytics, they also tracked revenue performance across different regions.
"We started running text, image, and video interstitials in late 2013, and we were amazed – we immediately began generating 10 to 20 times more revenue through AdMob."
– Jason Byrne, Founder, Eltsoft
Success Story: Monetization through Ad Mediation
Digitalchemy focused on ad mediation to maximize revenue from their educational utility apps, such as "Fraction Calculator Plus." Founders Aidan Hughes and Micah Koffron used Google AdMob mediation to streamline bidding across multiple ad networks. This strategy boosted their overall revenue by 30%, transforming their two-person operation into a full-time business with seven employees.
"AdMob offers a simple way to work with multiple ad partners to maximize fill rates and revenue, and we've seen a 30% to 40% bump in revenue since we started using mediation in AdMob."
– Micah Koffron, Head of Engineering, Digitalchemy
Success Story: Enhancing User Acquisition through Social Ads
Photomath highlighted the effectiveness of social media advertising by collaborating with TikTok creators through Spark Ads. They also A/B tested bid strategies, leading to 76,700 iOS installs and a 40% drop in CPA.
The table below summarizes the strategies and results from each case study for easy reference.
| Campaign | Key Strategy | Primary Result | Secondary Benefit |
|---|---|---|---|
| SplashLearn (Downloads) | Automated bidding & keyword research | 160% download uplift | 40% increase in TTR |
| Reading Eggs (Downloads) | Custom product pages | 42% of yearly iOS downloads | 7% boost in conversion rates |
| Eltsoft (Monetization) | Rich-media interstitials | 2,000% revenue increase | Focused localization efforts |
| Digitalchemy (Monetization) | Ad mediation | 30% revenue increase | Automated optimization |
| Photomath (Acquisition) | Creator partnerships | 76.7K installs | 40% lower CPA |
These examples clearly show how data-driven strategies and creative ad placements can transform advertising efforts into measurable success for teacherpreneurs.
Conclusion
Summary of ROI Best Practices
Boosting mobile ad ROI starts with keeping a close eye on every dollar spent and earned. Understanding the distinction between ROAS (Return on Ad Spend) and True ROI is crucial. ROAS only considers revenue against direct ad costs, while True ROI includes additional expenses like platform fees, creative production, and agency charges. Aiming for an LTV:CAC (Lifetime Value to Customer Acquisition Cost) ratio of at least 3:1 is key to building a sustainable business. Keep in mind that the median ROAS for mobile apps is just 2.04, meaning half of all apps fall below this benchmark.
Retention and engagement are just as important as acquisition. For instance, push notifications can increase user engagement by 230%, while gamified features can enhance interaction by 27%. Tracking micro-conversions such as email sign-ups and video views can help optimize your funnel. Additionally, strategies like A/B testing ad creatives, using Custom Product Pages tailored to specific search intent, and segmenting data by ad group, device, and region can uncover what’s truly driving your app’s performance.
"True marketing ROI accounts for every rupee you spend (ad networks, attribution tools, agencies, creative production) and every rupee your app generates." - Lakshith Dinesh, Linkrunner
Don’t forget to calculate your break-even ROAS using the formula 1 / Profit Margin (e.g., a 50% margin means a 2.0 ROAS is needed). Tracking the entire customer journey - from discovery to evaluation and conversion - and using predictive analytics to estimate user value within the first 24–48 hours after installation can elevate your strategy even further. Businesses leveraging predictive LTV-based optimization have reported a 30% boost in ROAS and saved 17% on their budgets.
Armed with these insights, you’re ready to fine-tune your approach.
Next Steps for Teacherpreneurs
Take these best practices and start by auditing your campaigns to uncover hidden costs. Shift focus to high-intent channels like Apple Search Ads, which have an impressive 67.2% conversion rate. Experiment with one new tactic - such as implementing Custom Product Pages or refining localized keywords - and assess the results before scaling.
DashK12 provides online courses, e-books, and resources tailored to help underpaid teachers transform into thriving entrepreneurs. Whether you’re launching your first mobile ad campaign or optimizing current efforts, DashK12 offers the tools and community support to turn your educational app into a profitable business. The teacherpreneurs highlighted in this guide didn’t succeed overnight - they tested, adjusted, and scaled their strategies. With a focus on ROI tracking and the resources at DashK12, you can follow in their footsteps and achieve similar success.
FAQs
What costs should I include when calculating ROI?
When working out ROI, make sure to account for all expenses tied to the project. This includes development, marketing, ongoing maintenance, and advertising costs. Factoring in these elements gives you a more accurate view of your campaign’s profitability and equips you to make smarter decisions for better results.
How do I know if my ROAS is high enough to break even?
To figure out if your ROAS is enough to break even, you need to compare it to your break-even point. This point depends on your profit margins and overall costs. A common benchmark is a ROAS of 2:1 - meaning you earn $2 for every $1 spent. However, always factor in your specific profit margins and the norms within your industry when assessing your performance.
Which metric should I optimize first: CPA, LTV, or conversion rate?
Focusing on improving your conversion rate is a smart move. Why? Because it directly boosts how efficiently you acquire users and strengthens your long-term profitability. These improvements naturally ripple out to enhance key metrics like LTV (Lifetime Value) and CPA (Cost Per Acquisition).
By increasing conversions, you're essentially laying down a solid base for stronger overall campaign results. It’s the kind of foundational work that pays off across the board.